
Looking for top-quality financial models and projections? Browse our site for Excel-based financial models, business plan templates, and samples. Get started with our expertly crafted business plan formats and examples. Accelerate your success today with FinModelsLab!
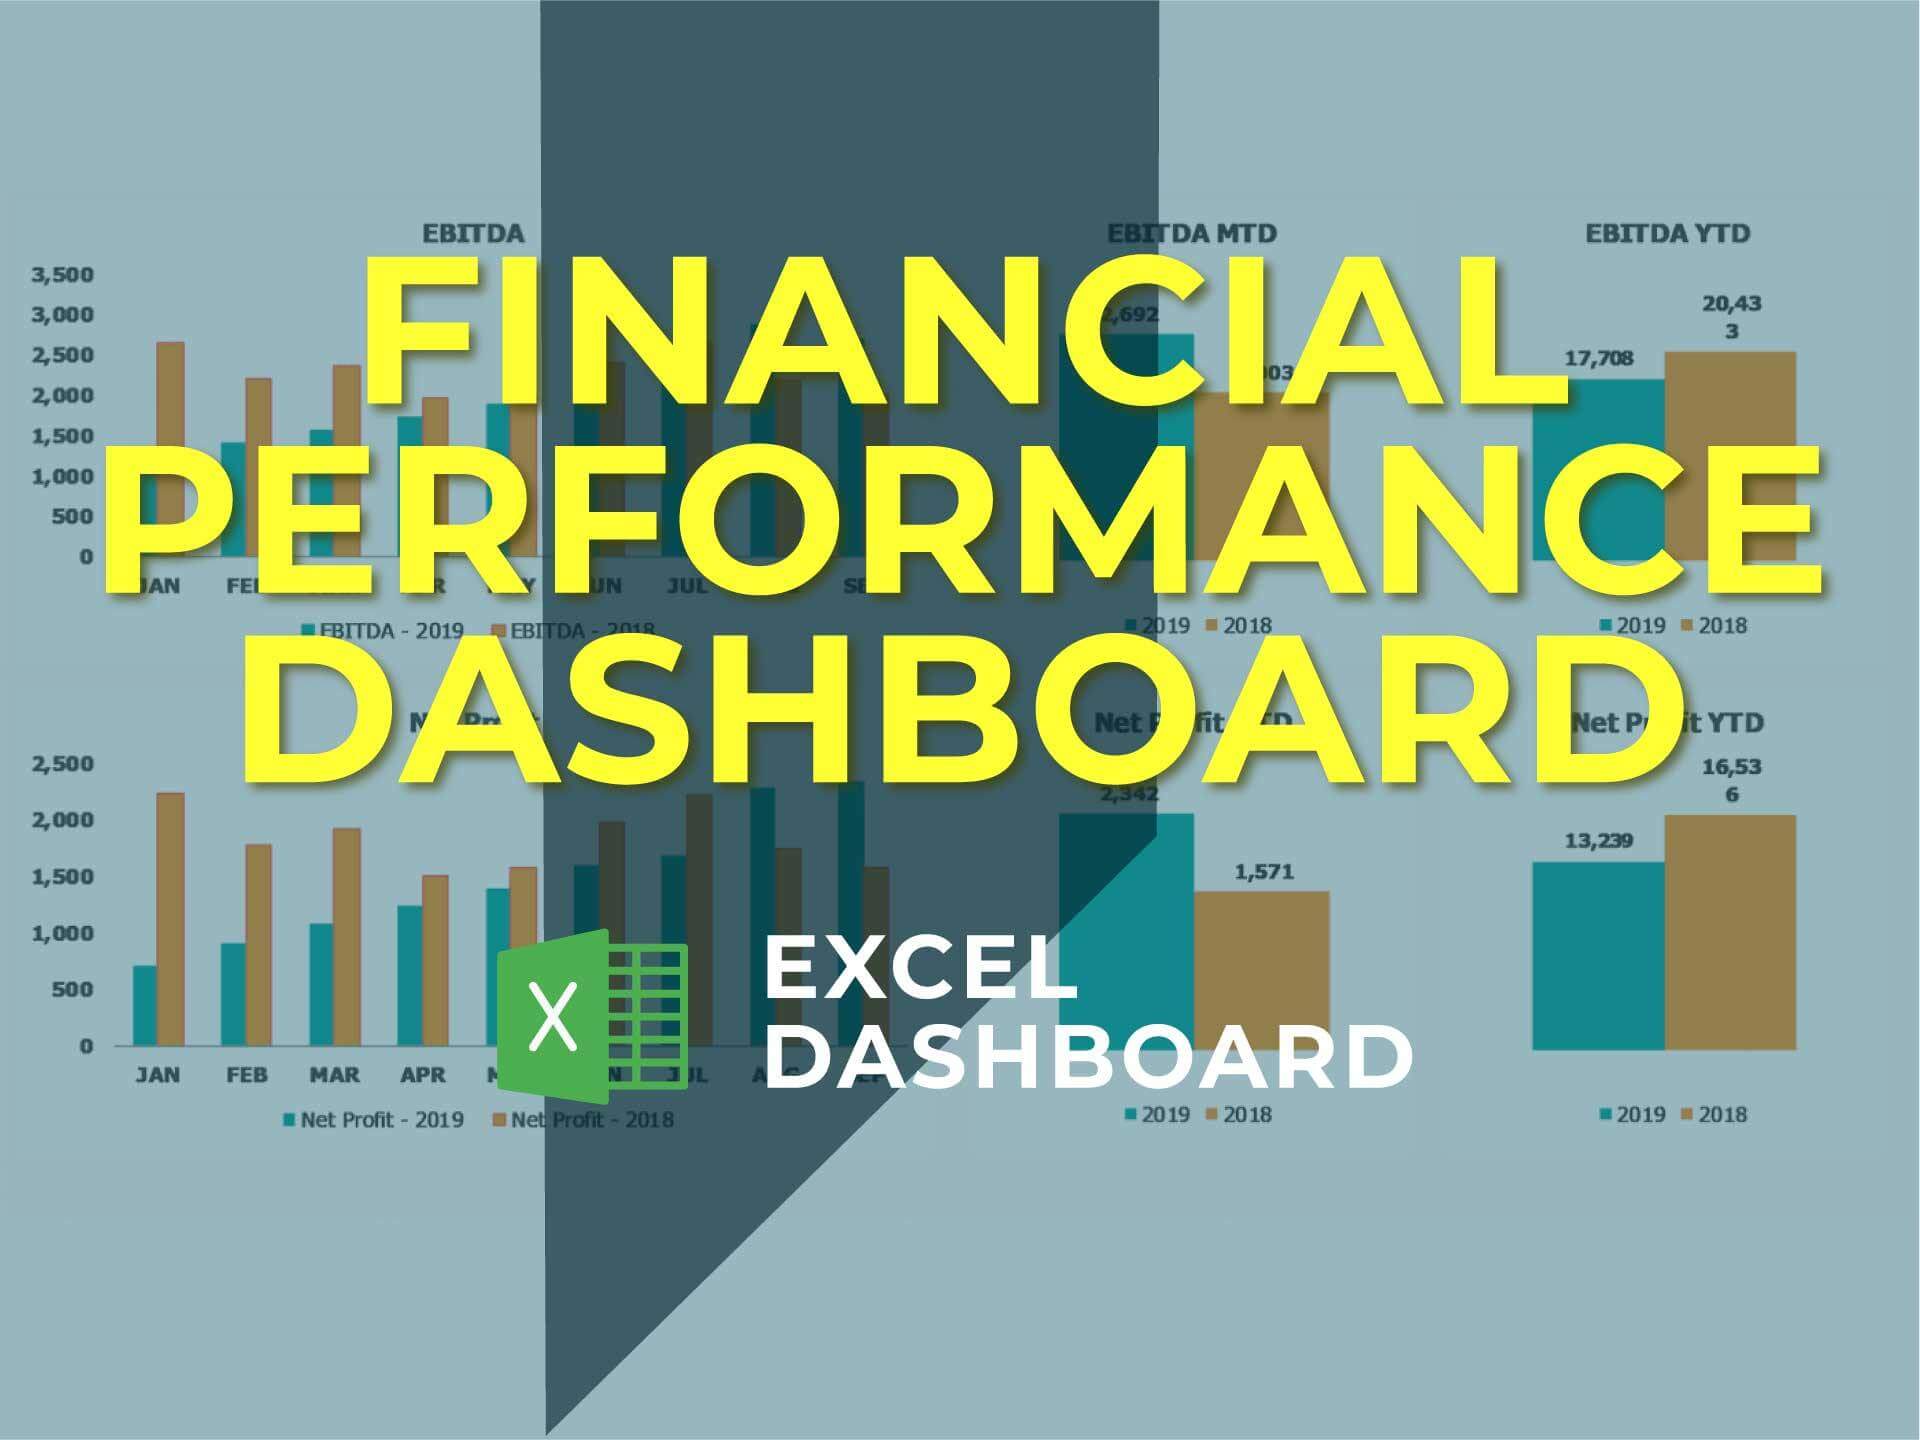
It’s hard to underestimate the importance of financial reporting every year. If you can read the financial statement, it will point up on strengths and weaknesses of your firm, help you to determine the possibilities for future growth and make your business attractive for investors. To create an accurate and smooth financial report, you need a knowledge of finance, budgeting, and accounting. Luckily now the business owner can find a lot of tools that can make the creation of financial statements much easier! EXCEL ANNUAL FINANCIAL PERFORMANCE DASHBOARD BUDGET KEY FEATURES Executive dashboard to visualize annual financial indicators Present financial data for investors or creditors Track your business with a performance dashboard Plan future development based on current financial indicators Professional charts make your KPIs stand out CFO dashboard to generate annual financial reports Total Revenue Cost of Goods Sold Gross Margin Total Operating Expenses EBITDA Net Profit FINANCIAL PERFORMANCE DASHBOARD CURRENT VS PREVIOUS YEAR DETAILS Shows you the core financial ratios: EBITDA, NET PROFIT as well all Month to Date (MTD) and Year To Date (YTD). On charts, you may find two data series related to the current year's data and the prior year. EBITDA & NET PROFIT Current vs Previous year details on the Main Page of <a data-lwsa=Financial Performance Dashboard [https://finmodelslab.com/products/performance-dashboard-excel]" src="https://cdn.shopify.com/s/files/1/0522/6191/2762/products/Financial-Performance-Dashboard-3-Current-Vs-Previous-Year-Details.png?v=1611143402"> EBITDA & NET PROFIT Current vs Previous year details on the Main Page of Financial Performance Dashboard GROSS MARGIN RATIO ON THE FINANCIAL PERFORMANCE DASHBOARD Gross Margin KPI show for the Month to Date (MTD) and Year To Date (YTD). The charts show you two data sets related to the current year's data and the year before. Gross Margin KPI Performance charts [https://cdn.shopify.com/s/files/1/0522/6191/2762/products/Financial-Performance-Dashboard-7-Gross-Margin.png?v=1611143402] Gross Margin KPI Performance charts EARNINGS BEFORE INTEREST, TAXES, DEPRECIATION AND AMORTIZATION (EBITDA) ON THE FINANCIAL PERFORMANCE DASHBOARD EBITDA MTD (Month to Date) and YTD (Year To Date). Graphs show you two data related to the current year's data and the year before. EBITDA Charts [https://cdn.shopify.com/s/files/1/0522/6191/2762/products/Financial-Performance-Dashboard-6-Ebitda.png?v=1611143402] EBITDA Charts NET PROFIT RATIO AT THE FINANCIAL PERFORMANCE DASHBOARD Net profit ratio showed YTD and MTD for the current and past years Financial Performance Dashboard Net profit [https://cdn.shopify.com/s/files/1/0522/6191/2762/products/Financial-Performance-Dashboard-5-Net-Profit.png?v=1611143402] Financial Performance Dashboard Net profit FINANCIAL PERFORMANCE DASHBOARD REVENUE METRICS Revenue comparison of the current and past year Revenue amounts at the Financial Performance Dashboard [https://cdn.shopify.com/s/files/1/0522/6191/2762/products/Financial-Performance-Dashboard-4-Revenue.png?v=1611143402] Revenue amounts at the Financial Performance Dashboard VARIANCE ANALYSIS AT THE PERFORMANCE DASHBOARD Variance Analysis of the current and past years. It shows how each of the metrics was changes in comparison to the past year in absolute amount and percentage. Variance Analysis is the core report of the Performance Dashboard [https://cdn.shopify.com/s/files/1/0522/6191/2762/products/Financial-Performance-Dashboard-8-Variance-Analysis.png?v=1611143402] Variance Analysis is the core report of the Performance Dashboard WATERFALL CHART AT THE FINANCIAL PERFORMANCE DASHBOARD Waterfall Chart shows the changes of the Net Profit during the last 12 month till the selected period Waterfall Chart to highlight the changes over the period of last 12 month [https://cdn.shopify.com/s/files/1/0522/6191/2762/products/Financial-Performance-Dashboard-9-Waterfall-Chart.png?v=1611143402] Waterfall Chart to highlight the changes over the period of last 12 month FINANCIAL PERFORMANCE DASHBOARD ACTUAL INPUTS At this tab, you will enter actual information broken down by month This is the main tab where all ratios should be entered by month [https://cdn.shopify.com/s/files/1/0522/6191/2762/products/Financial-Performance-Dashboard-10-Actuals.png?v=1611143402] This is the main tab where all ratios should be entered by month